GAISE 2016 Recommendation #1:
Teach statistical thinking.
- Teach statistics as an investigative process of problem-solving and decision-making.
- Give students experience with multivariable thinking.
Explanatory variables have already been introduced in graphics:
- x-axis
- color
- facet
Now we will use the explanatory variables to define discrete groups over which to stratify the response variable.
Objectives of Stratification chapter:
- You can make narrower summary intervals by stratifying the response variable on explanatory variables
- Stay away from difference in means but
- Still have a very low mathematical overhead
- Introduce very simple DAGs
- The relationship we want to study: \(X \rightarrow Y\)
- But there are other factors: \(X \rightarrow Y \leftarrow C\)
- Stratify by both X and C to “clarify” \(X \rightarrow Y\)
- But don’t introduce confounder DAG yet
- Tutorial
Activity 5.1 The graph plots winning time in the Scottish hill races as a function of climb (in meters) and distance (in km). There is a jittered data layer as well as an interval layer showing the 95% prediction interval.
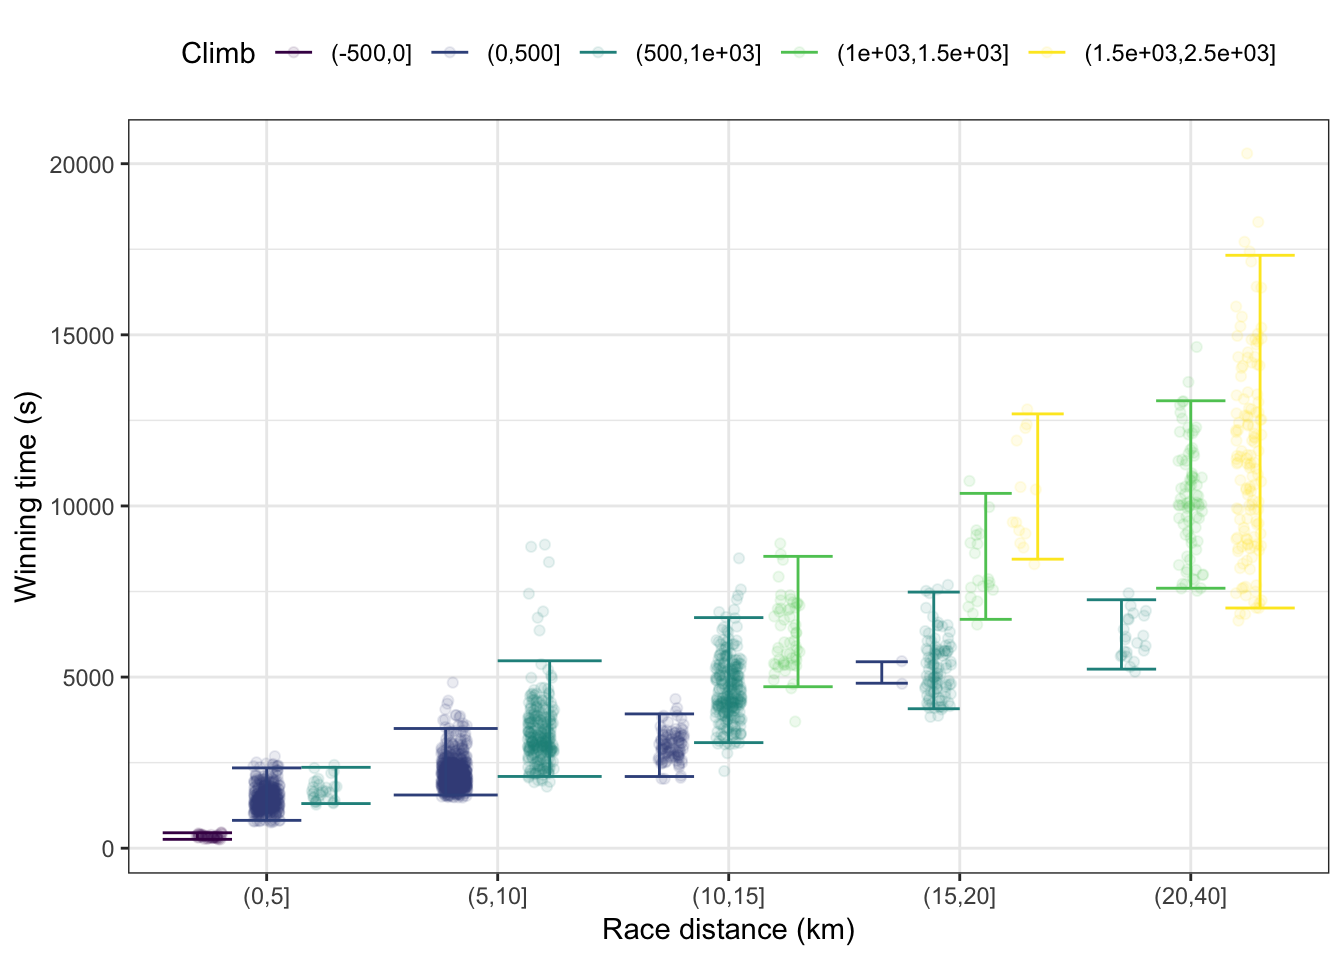
- What is the unit of observation for the data layer.
- How many different strata for race distance are there?
- From the legend you can see that there are five strata for climb. Yet not every climb stratum shows up for each distance stratum. State, in everyday terms, why some strata are missing.
- Your friend, a competitive hill racer, is planning to run a race with a distance of 13 km and a climb of 1200 m. Make a prediction, in the form of a 95% interval, of how long the race will take for the winner.
- The Scottish hill racing data includes both male and female winners. Make a simple sketch of what the interval plot would look like if sex were included as an explanatory variable in the interval plot. (You can be casual about the exact lengths and positions of the individual prediction intervals.)