Center
We push mean, “central tendency”, median very hard.
- “The most representative single value.”
But why do we need to use a single value to represent a distribution? Isn’t an interval more informative? And don’t we want our students to learn to deal with intervals?
Use summary intervals e.g. at 85% or 95%
Standard deviation
- Normal distibution is over-emphasized.
- Archaic name, archaic concepts: “deviation,” “normal,” “l’homme moyen,” “error”
- Standard formula emphasizes distance from mean, not between individuals.
- Hard to eyeball from data, impossible to eyeball from data frame.
No covariates
Focus on small n
t distribution. With
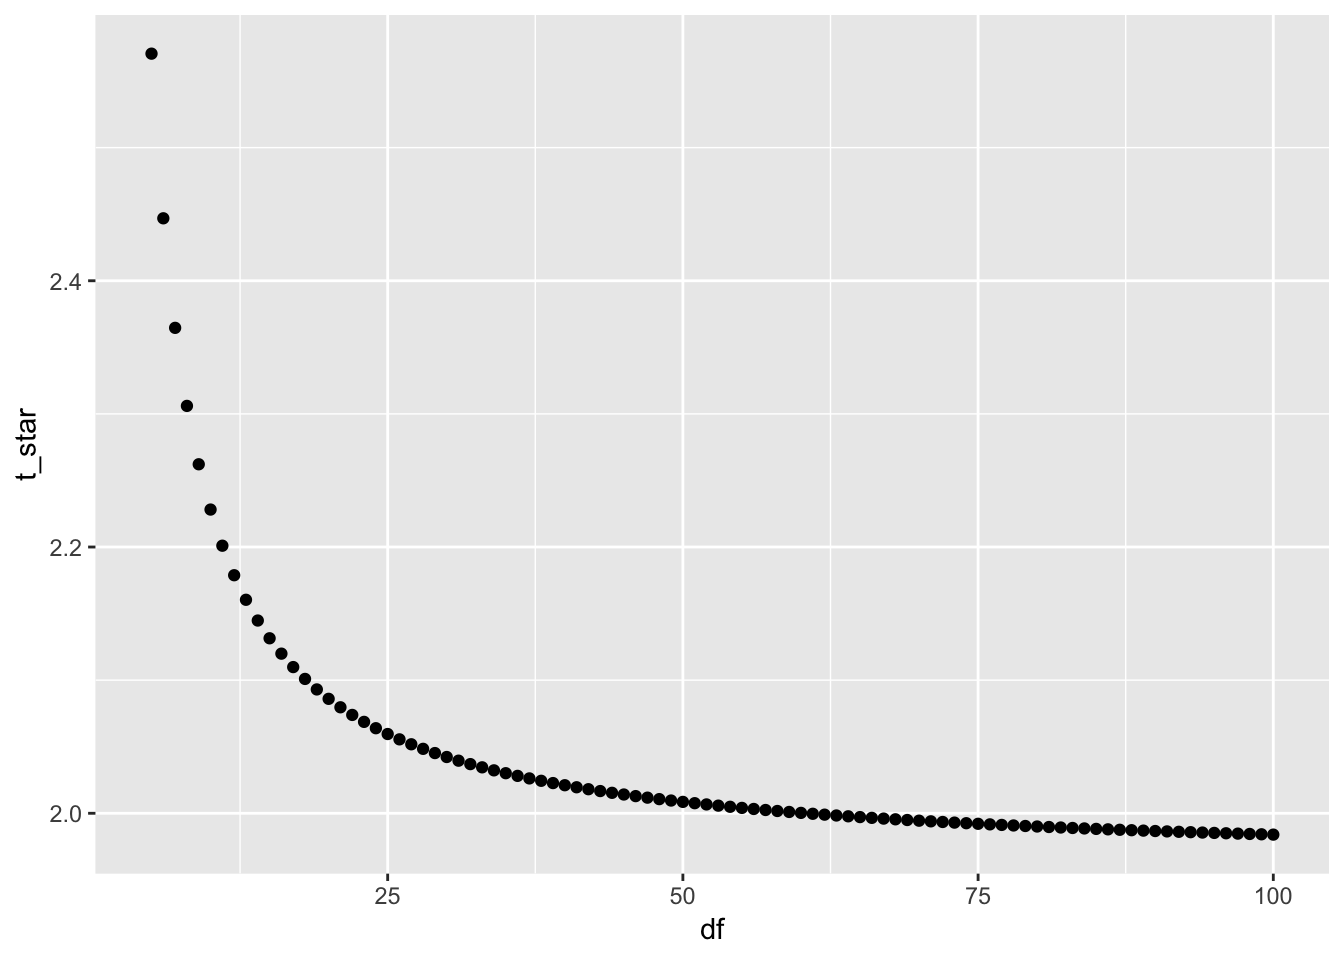
- Data science
False precision
How precise an estimate do we need? How much precision is needed in a summary interval, a coverage interval? 5%? 10%? So 2.2 is no different from 1.96.
Show some tables from Triola
How big?
Examples of quantities to which dimensions are regularly assigned are length, time, and speed, which are measured in dimensional units, such as metre, second and metre per second. This is considered to aid intuitive understanding. However, especially in mathematical physics, it is often more convenient to drop the assignment of explicit dimensions and express the quantities without dimensions, e.g., addressing the speed of light simply by the dimensionless number 1.* – Wikipedia
- t
- F
- \(\chi^2\)
p-value
r at least relates quantities with dimension: 1 sd of the explanatory var is associated with r sd of the response var.
Unnecessary distinctions
Breaks up closely related subjects into different formalisms: ∆p, ∆m, slope
Let’s connect these more tightly.
Reasoning process of statistical inference
Show some formulas from Triola